Therefore, it is not surprising that over the past few years there have been several reports published on India which talk about the future prospects of the economy and stocks to invest in. This formula is being followed for two decades.
One such report published recently by Morgan Stanley Research (MSR) states that India has changed in less than a decade. It makes its case by highlighting 10 big changes in the Indian economy, while cherry-picking data and omitting specifics.
Take gross foreign direct investment (FDI) coming into India, which the report shows as an upward sloping curve. The gross figure does not include repatriation/disinvestment that takes place every year. It also does not take into account the growing size of India’s economy. Once we do this, the figure for 2022-23 becomes 1.2% of GDP, up from 3.5% in 2008-09. Over the past 10 years, it has ranged from 1.2% to 2.1%.
A case has been made for how India’s corporate income tax rate is now in line with its peers. In fact, corporate income tax collections peaked at 3.9% of GDP in 2007-08 and fell to 3.5% in 2018-19, a year before the pandemic struck. The ratio was 3% in 2021-22 and 3.1% in 2022-23.
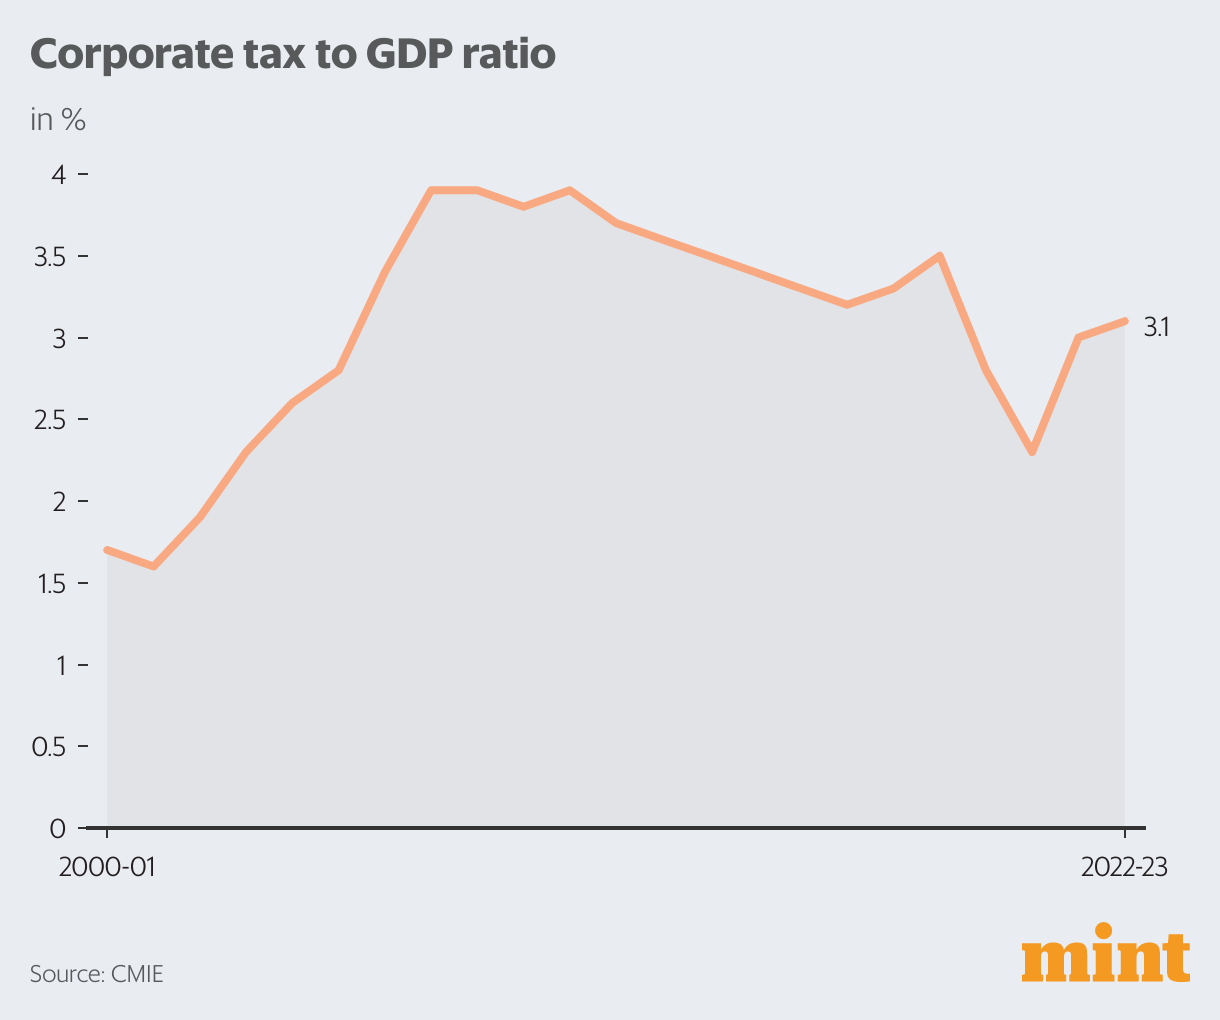
The post-2019 decline in corporate tax collections is on account of the corporate income tax rate cut in September 2019. Here’s the thing: Corporates have made windfall profits after 2019 due to low interest rates and rising economic formalization.
In fact, a sample of over 30,000 companies, both listed and unlisted, tracked by the Center for Monitoring Indian Economy suggests that from 2018-19 to 2021-22, total sales grew by 21%. Profit after tax – thanks to lower tax rates and lower interest rates – increased by a whopping 237%. In comparison, the tax provisions of these companies increased by only 37 per cent. Clearly, the corporate tax-rate cut has come at a high cost, with individuals paying more taxes to make up for it.
Another thing that has been said in the report is that after 2014 inflation has been low. This is true. However, in 2011–12, 2012–13 and 2013–14, the average price of the Indian basket of crude was above $100 per barrel, which has not happened since then. It was necessary to mention it.
Then there’s the fund managers’ favorite – pouring huge sums of money into mutual funds (MFs) through Systematic Investment Plans (SIPs). It has been an upward sloping curve over the years, with the amount being invested in MFs through SIP increasing every year. The MSR report cites this upward sloping curve as an example of some of the changes that have occurred over the years.
Investment through SIP was average in 2016-17 3,660 crores in a month. By 2022-23, they had jumped 13,000 crores in a month. MSR calls this India’s ‘401(k) moment’ to make the data more palatable to American audiences.
The trouble is that here again the nuances have disappeared. Investors make money through SIP only when they hold their investments for some time. Nonetheless, according to a recently published consultation paper by the Securities and Exchange Board of India (SEBI), only 3.1% of MF units redeemed by investors in 2022-23 were held for more than five years. It was 2.6% in 2021-22. More than half of the MF units are redeemed within a year of investment.
This clearly tells us that when investors are investing through SIP, they are not holding their investments for long, which means that equity investment will eventually prove to be a disappointment for them. The MSR report does not go into these details.
Of course, like every other report these days, MSR touts how Indians have adopted digital payments like a fish to water. While this suggests convenience for consumers and better data for government and financial firms, it in no way suggests an increase in the ability to consume things. Most of these transactions are of small value and were already taking place in cash.
There is also no mention of a K-shaped economic recovery after the pandemic. Two-wheeler sales in 2022-23 were to be the same as in 2014-15. While sales of entry-level cars have come down, there is a waiting period for SUVs. Airline travel nearly recovered to pre-pandemic levels in 2022-23, but non-suburban rail travel was down 29% from 2018-19.
There is also no mention of sluggish rural consumption. Sales of FMCG companies – the number of units of different products sold by these companies – haven’t been looking good for a while. As Ritesh Tiwari, chief financial officer of Hindustan Unilever, said on April 27income call: “We need to keep in mind that the FMCG market volumes have been declining for almost one-and-a-half years. The volume of the rural market is still declining.”
Then there is the matter of work sought under the Mahatma Gandhi National Rural Employment Guarantee Scheme (MGNREGS), India’s work guarantee scheme. Last month, 31.74 million households demanded work under it – more than ever in the month of May, except in 2020 right after the pandemic.
In fact, the demand for work by households during April-May has been the highest for the first two months of the financial year – even higher than in April-May 2020. This is another indicator of the Kashmir-sized economic recovery that India is currently experiencing.
In addition, direct-benefit transfers to the population have increased over the years. it cost standing 3.82 trillion or 1.9% of GDP in 2019-20. it has since jumped 6.67 trillion or 2.45% of GDP in 2022-23. This increase again indicates that the financial situation of many Indians is shaky.
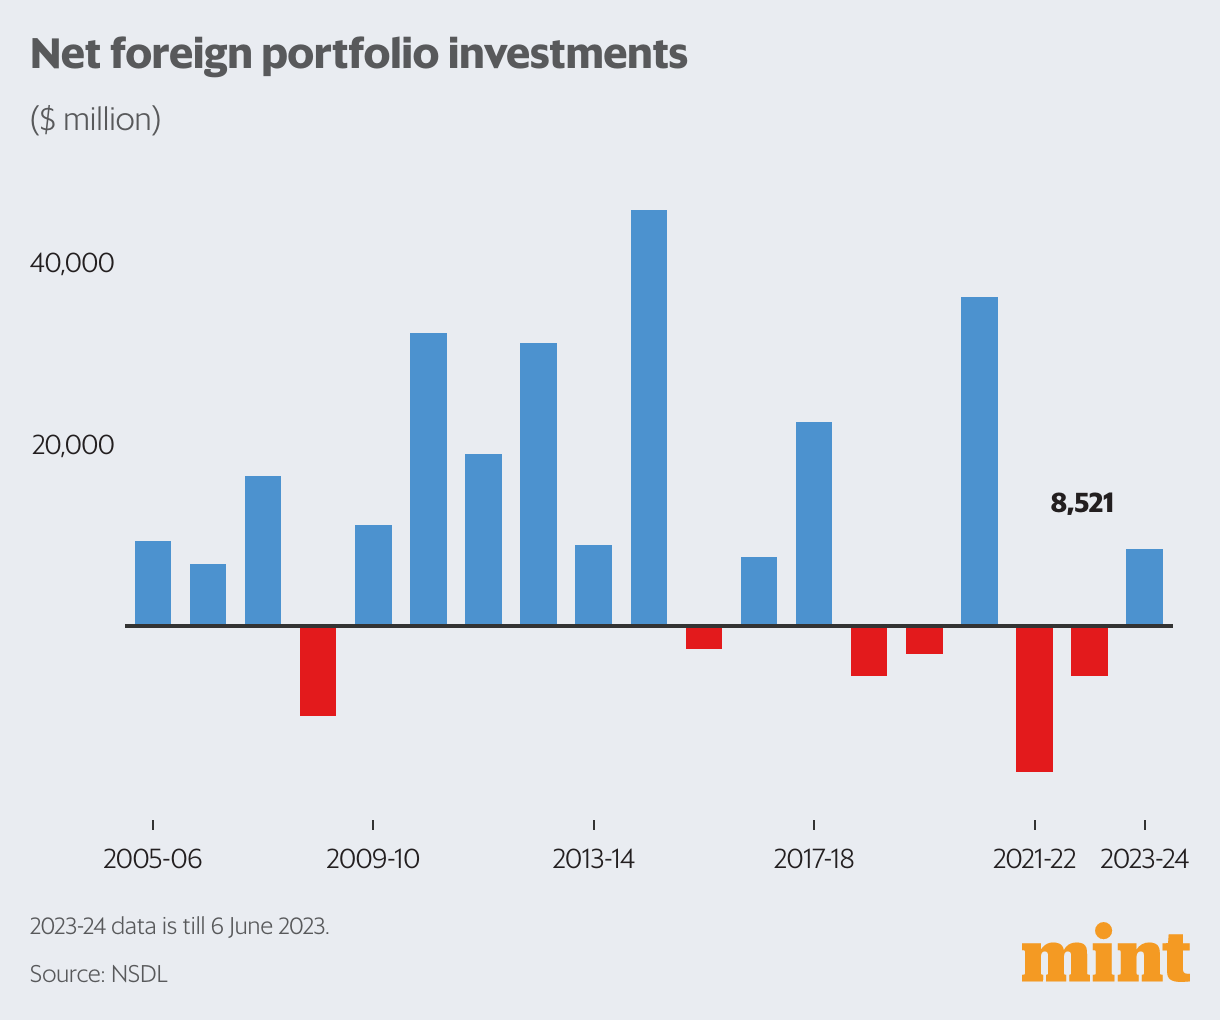
Interestingly, the report has a chart that shows the money invested by foreign portfolio investors (FPIs) in Indian stocks and debt. In the years prior to 2017-18, FPI brought in the most money in India (take a look at the accompanying chart). Of course 2020-21, when western central banks cut interest rates to almost zero, was an exception.
Finally, in 2015-16, India’s agriculture sector was about 4% larger than manufacturing (in nominal terms). In 2022-23, agriculture was 25% bigger than manufacturing. This is despite increased tariff protection and programs such as production-linked incentives to encourage companies to make in India. The MSR report completely denies this. The history of economic development tells us that no country has gone from developed to developed without moving people from agriculture to manufacturing.
As economist Ha-Joon Chang writesBad Samaritans—The Guilty Secret of Rich Countries and a Threat to Global Prosperity:“History has shown time and time again that the single most important thing that separates rich countries from poor ones is basically their higher capacity in manufacturing, where productivity is generally higher, and more importantly where productivity grows faster than in agriculture and services.”
The reverse seems to be happening in India. The Periodic Labor Force Survey of the government also confirms this. Latest annual data is available for the period July 2021 to June 2022. The proportion of workforce in agriculture has increased from 42.5% in 2018-19 to 45.5% in 2021-22.
All this leads us to a larger point: how can any serious report on the Indian economy ignore these all-important figures? This can only be done by choosing to create a narrative and leaving out any nuances.
This is not to say that all is doomed. no way. The investment scene seems to be turning around. Bad loans of banks and corporate loans have both come down. Goods and Services Tax collections have improved due to better implementation (and higher inflation). Service exports are also increasing.
In fact, as has happened in the past, the stock market can do well regardless of how the economy performs. The increasing formalization of the economy could be one of the reasons for this. Second, if central banks in the West go back to low interest rate policy, money could come in and stock prices could go up as in 2020 and 2021.
Vivek Kaul is the author of ‘Bad Money’.
catch all business News, market news, today’s fresh news events and Breaking News Update on Live Mint. download mint news app To get daily market updates.
Updated: June 07, 2023, 09:58 AM IST